Power BI
Citi Bike NYC: Station Flow Dashboard
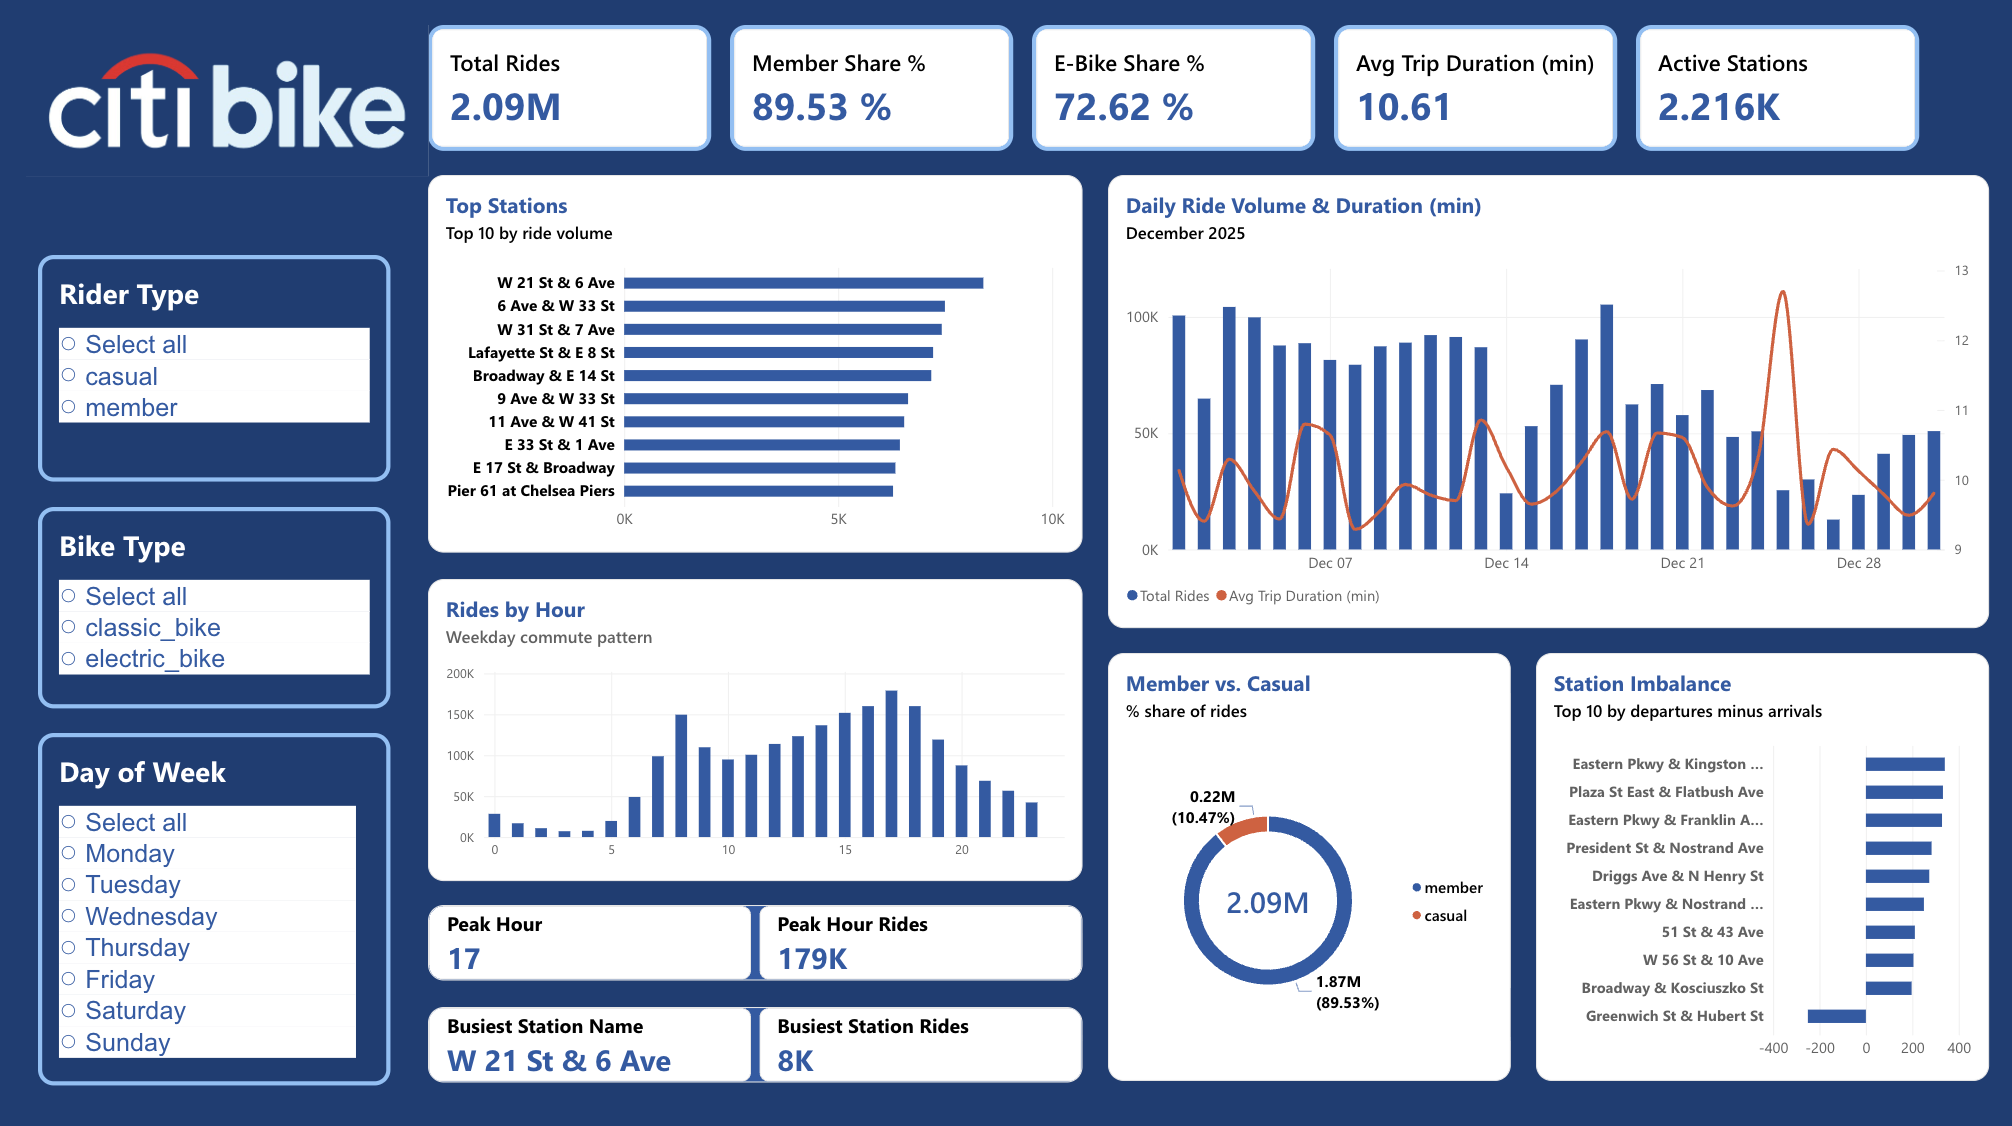
Modeling 2.1M real December 2025 Citi Bike rides to find which NYC stations need rebalancing, and when.
- Rides analyzed
- Rides by members
- Rides on e-bikes
Problem
Bike-share systems only work if bikes are where riders need them. Citi Bike's fleet naturally drifts throughout the day: riders empty residential neighborhoods in the morning and fill up job centers, leaving some stations chronically short and others overflowing. Without station-level visibility into that flow, there's no way to know where rebalancing trucks should actually go.
Approach
Built a single-page Power BI dashboard on real Citi Bike NYC trip data (citibikenyc.com/system-data), no sample or synthetic rows: 2,091,620 rides from December 2025. Modeled a dedicated Stations dimension table with two relationships back to the trip log, one active on the starting station and one inactive on the ending station, activated on demand with USERELATIONSHIP. That let departures and arrivals get computed independently per station rather than just totaling ride volume.
Key Technical Challenges & How I Solved Them
Challenge
Departures and arrivals both relate to one station table, but a model allows only one active relationship.
Solution
Built a Stations dimension with an active start-station and inactive end-station relationship, activated in DAX with USERELATIONSHIP.
Challenge
Ride volume alone hid where bikes actually pile up or run out.
Solution
Computed departures and arrivals independently per station to expose net imbalance.
Challenge
4,391 rides ended with no station recorded.
Solution
Excluded them from station rankings rather than smoothing them over.
Results
Ridership follows a sharp weekday commute pattern: two clear peaks around 8am and 5 to 6pm, close to empty overnight. Members account for 89.5% of rides and e-bikes for 72.6%, so this is overwhelmingly a commuter tool, not a tourist one. Raw volume and rebalancing need point to different neighborhoods entirely: Chelsea's W 21 St & 6 Ave is the single busiest station by departures, but the real imbalance problem sits in Crown Heights and Bed-Stuy, where stations like Eastern Pkwy & Kingston Ave bleed hundreds of bikes each morning as residents ride out to transit and work. Also worth noting: 4,391 rides that month ended with no station recorded at all, consistent with docking failures, and were filtered out of the station rankings rather than smoothed over. Weight morning rebalancing capacity toward the Eastern Pkwy corridor first, where departures consistently outpace arrivals. A handful of stations run the opposite problem and need periodic emptying instead of refilling.
Screenshots
Project files
Power BI Dashboard File
Power BI report (.pbix)
Built by Pavle Ristić. Free to download and explore, please credit if you reuse any part of it.