Tableau
NYC Airbnb Pricing Analysis
Regression analysis of 48,895 NYC Airbnb listings to identify the strongest drivers of nightly price, paired with an interactive Tableau dashboard for exploring the results.
- Listings analyzed
- Premium for entire home
- Top segment nightly avg
Problem
What factors most strongly explain Airbnb nightly price in New York City, and how can that be used to guide pricing decisions? Hosts and platforms often set prices on instinct or by copying nearby listings, without a clear sense of which factors actually move the needle once everything else is held constant.
Approach
Working with a public dataset of 48,895 NYC Airbnb listings across all five boroughs, I moved through four stages: descriptive statistics to understand the shape of the data, pivot tables to compare price by room type and borough, correlation analysis to check which variables had a real linear relationship with price, and finally a multiple regression model to test which factors still mattered once controlling for the others. I built a companion interactive Tableau dashboard so the underlying patterns (price by borough, by room type, and the combination of both) could be explored directly rather than just read as static numbers.
Key Technical Challenges & How I Solved Them
Challenge
Price is heavily right-skewed (mean $152.72 vs. median $106.00).
Solution
Compared medians and segments instead of trusting one citywide average.
Challenge
Room type and borough overlap, so simple pivots blur each effect.
Solution
Ran a multiple regression to isolate each factor while controlling for the others.
Challenge
Popularity signals behaved against intuition.
Solution
Checked correlations first, revealing busier hosts price slightly lower to protect occupancy.
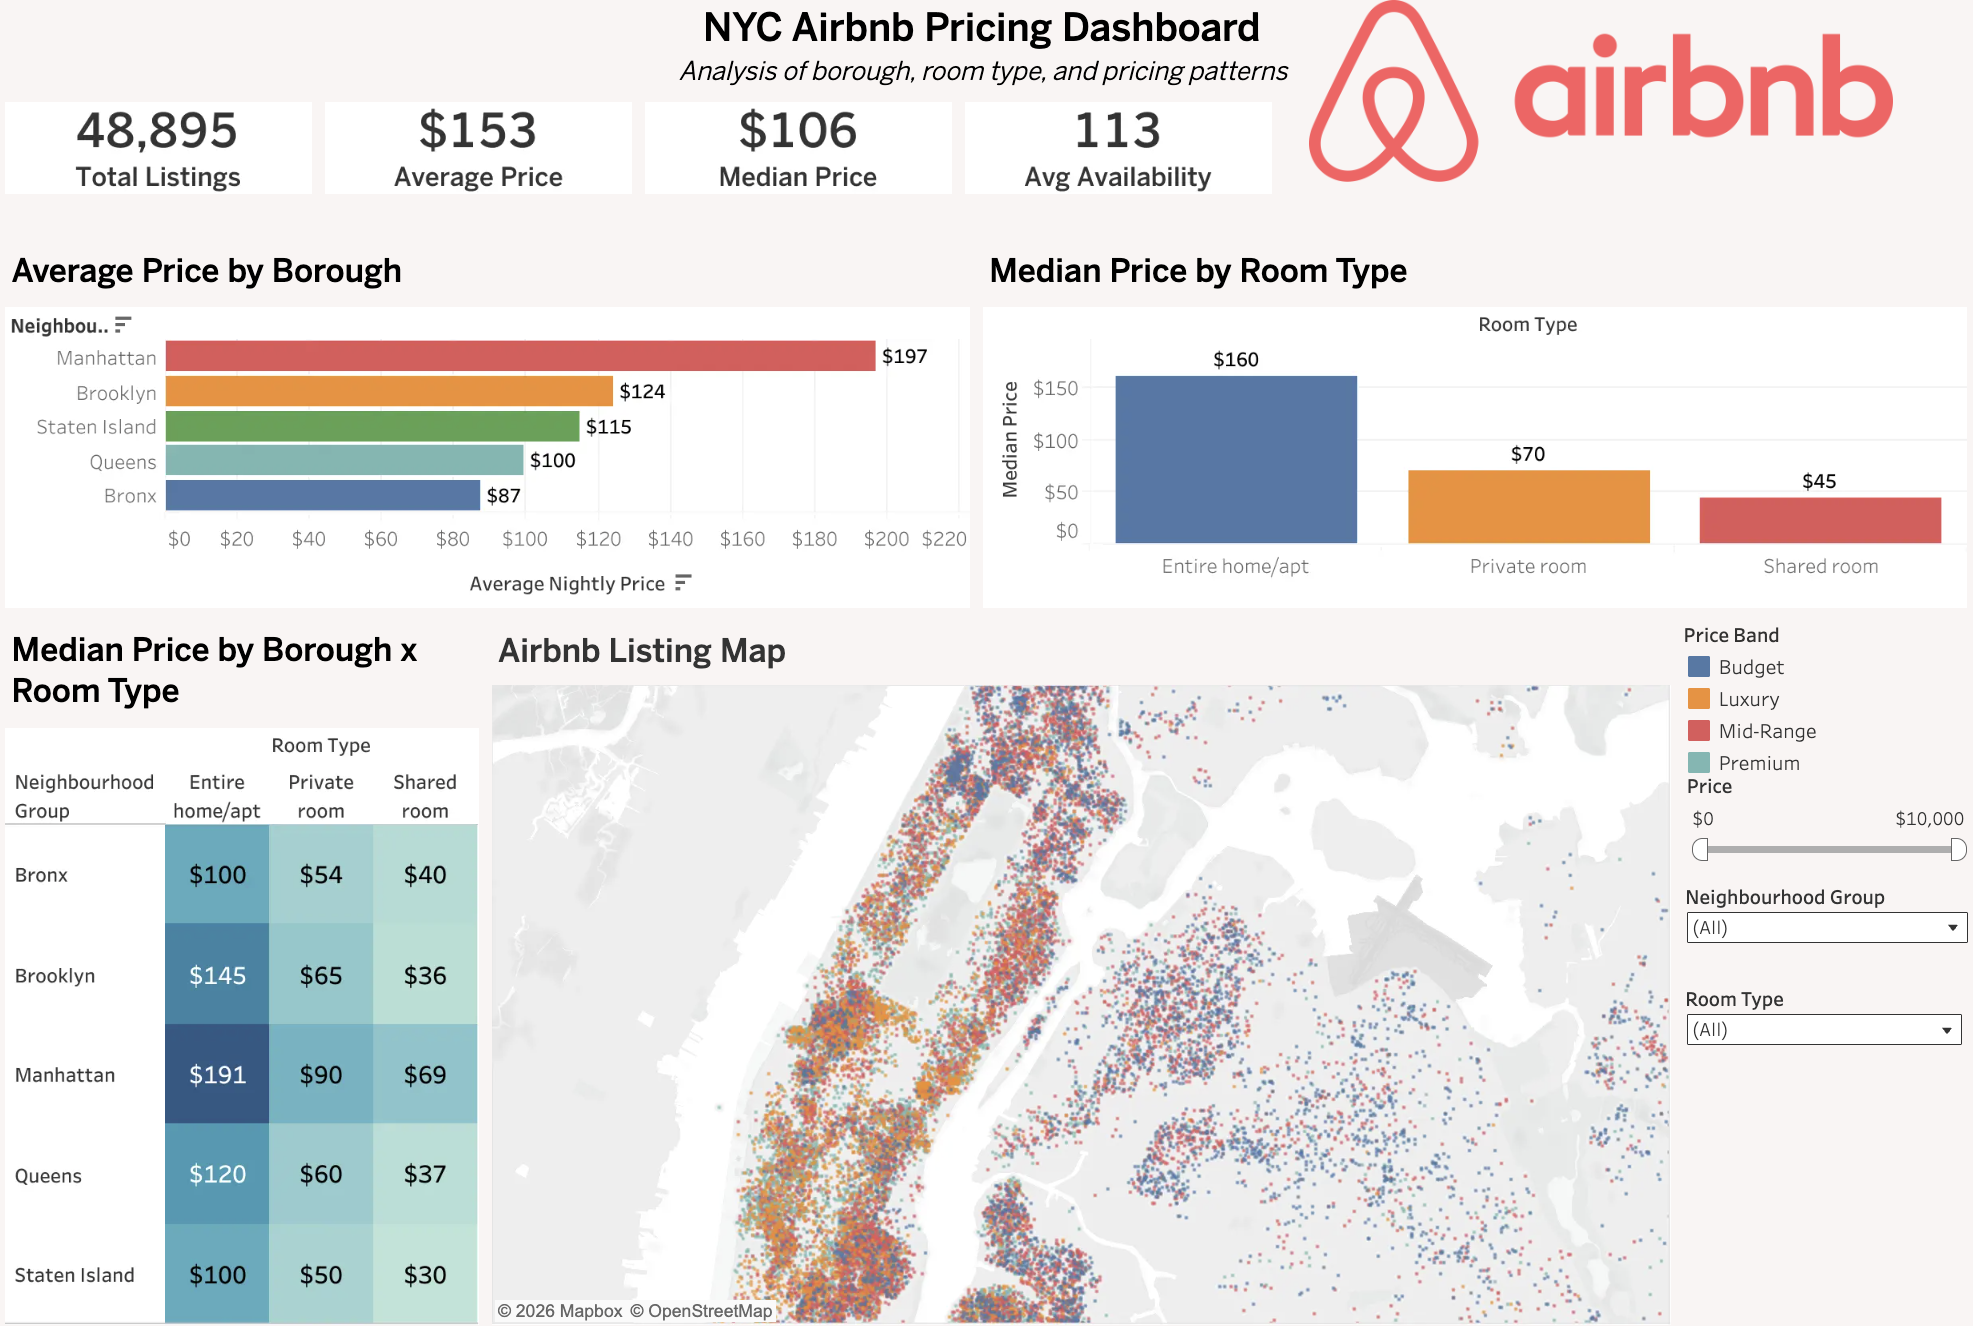
Dashboard
Results
Two variables dominated. Room type and Manhattan location were the strongest, statistically significant predictors of price even after controlling for everything else in the model: entire home/apartment listings command about $109 more per night, and Manhattan listings add roughly $59 more, holding other factors constant. The two compound: the highest-priced segment (entire home/apt in Manhattan) averages $249.24 a night, nearly five times the lowest segment (shared room in Brooklyn) at $50.53. Just as interesting was what didn't behave as expected. Listings with more reviews, more frequent recent activity, and hosts managing more properties actually trended toward slightly lower prices, suggesting these hosts price more competitively to protect occupancy rather than charging a premium for popularity. And because price is heavily right-skewed (mean $152.72 vs. median $106.00), a single citywide average price is a misleading benchmark for anyone setting rates. Pricing guidance should anchor on the two variables that actually move price: room type and borough, not a flat citywide number. A new listing's baseline price should start from its position on that room-type-by-borough grid, then adjust from there. Minimum-night requirements are better used as an occupancy and turnover lever than a pricing lever, since they showed no meaningful relationship with price. And since the model explains about 9.6% of price variation on its own, the natural next step is expanding it with data this dataset doesn't capture: amenities, bedroom count, guest ratings, photos, and seasonality, all of which likely account for a meaningful share of the remaining variation.
Dataset
NYC Airbnb Analysis