Tableau
Phoenix Police Calls for Service: 2025 Operations Dashboard
Interactive Tableau dashboard analyzing 568,000+ Phoenix Police dispatch calls from 2025: volume trends, call types, timing patterns, and outcomes.
- Calls analyzed
- Call type categories
- Closed as No Action Required
Problem
Public safety data gets published constantly, but it rarely turns into something a resident, journalist, or analyst can actually explore. I wanted to see what almost 570,000 police dispatch calls in one city, in one year, actually look like: when they happen, what they're about, and how they get resolved once officers respond.
Approach
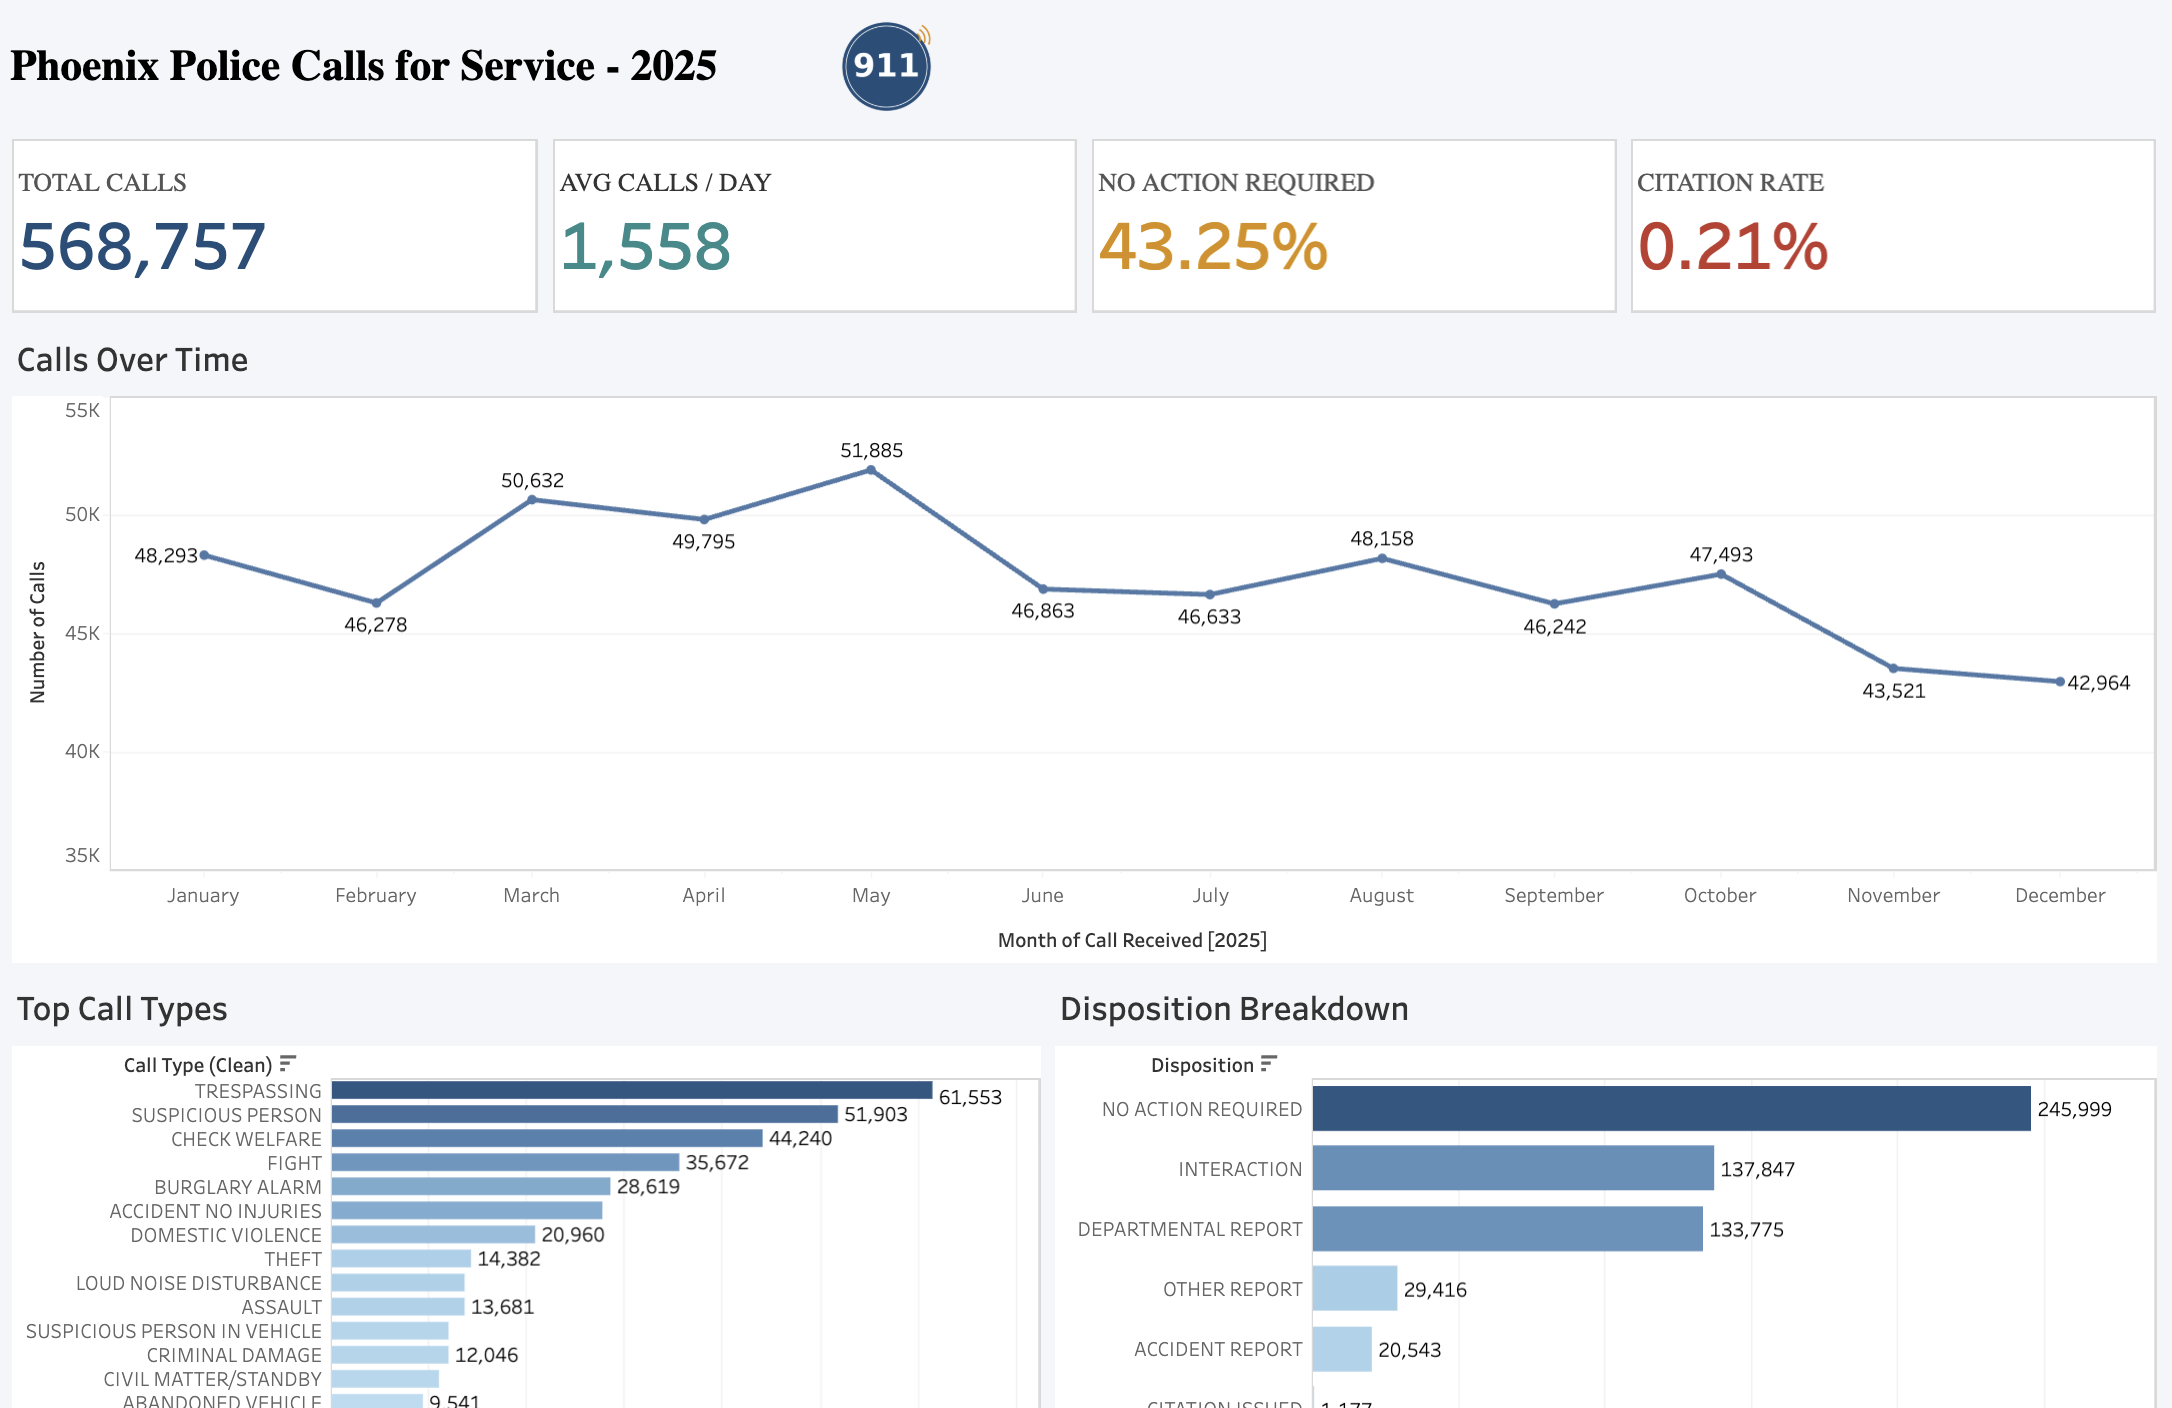
I pulled the full 2025 Calls for Service dataset from the City of Phoenix's open data portal (568,757 records, 8 fields) and built the dashboard in Tableau Desktop. After cleaning inconsistent text formatting baked into several fields with calculated TRIM fields, I built four core views: a monthly volume trend, a ranked breakdown of the top call types out of 371 total categories, an hour-by-weekday heat map of call timing, and a breakdown of how calls are ultimately resolved. I layered in KPI summary cards, a consistent color system, and custom tooltips before publishing to Tableau Public.
Key Technical Challenges & How I Solved Them
Challenge
Inconsistent text formatting baked into several fields broke grouping.
Solution
Created calculated TRIM fields so categories aggregated cleanly.
Challenge
371 call types are too many to read on one chart.
Solution
Ranked the top call types so the biggest drivers surface first.
Challenge
Timing patterns were invisible in a simple trend line.
Solution
Built an hour-by-weekday heat map to show when demand actually peaks.
Dashboard
Results
Two things stood out. First, nearly 43% of all calls close as "No Action Required," meaning almost half of everything Phoenix PD dispatches doesn't end in any enforcement action, a real signal about how much non-criminal work patrol officers actually handle. Second, call volume isn't flat across the week: it builds through the morning and stays elevated into the evening, a pattern that matters directly for shift staffing. I'd use the hour-by-weekday pattern to check patrol staffing against actual demand rather than fixed shift blocks, and track the "No Action Required" rate as its own ongoing metric, since a rising share of no-action calls could point to opportunities for routing certain call types to non-sworn responders instead of patrol officers.