Power BI
Reading a Year of Real Orders: A Power BI Dashboard
Turned 506,738 real UK retail transactions into one interactive Power BI dashboard, built and cleaned from scratch, no pre-made categories, no fictional data.
- Order lines cleaned
- Revenue in Sep to Dec
- Annual revenue analyzed
Problem
Most portfolio dashboards run on data that's already clean. I wanted one that had to earn it: a public dataset of real UK online retail transactions with no product categories, no profit field, and cancellations mixed in with real sales, then a real analyst's task on top, turn a full, messy year into one screen a merchandising lead could actually use.
Approach
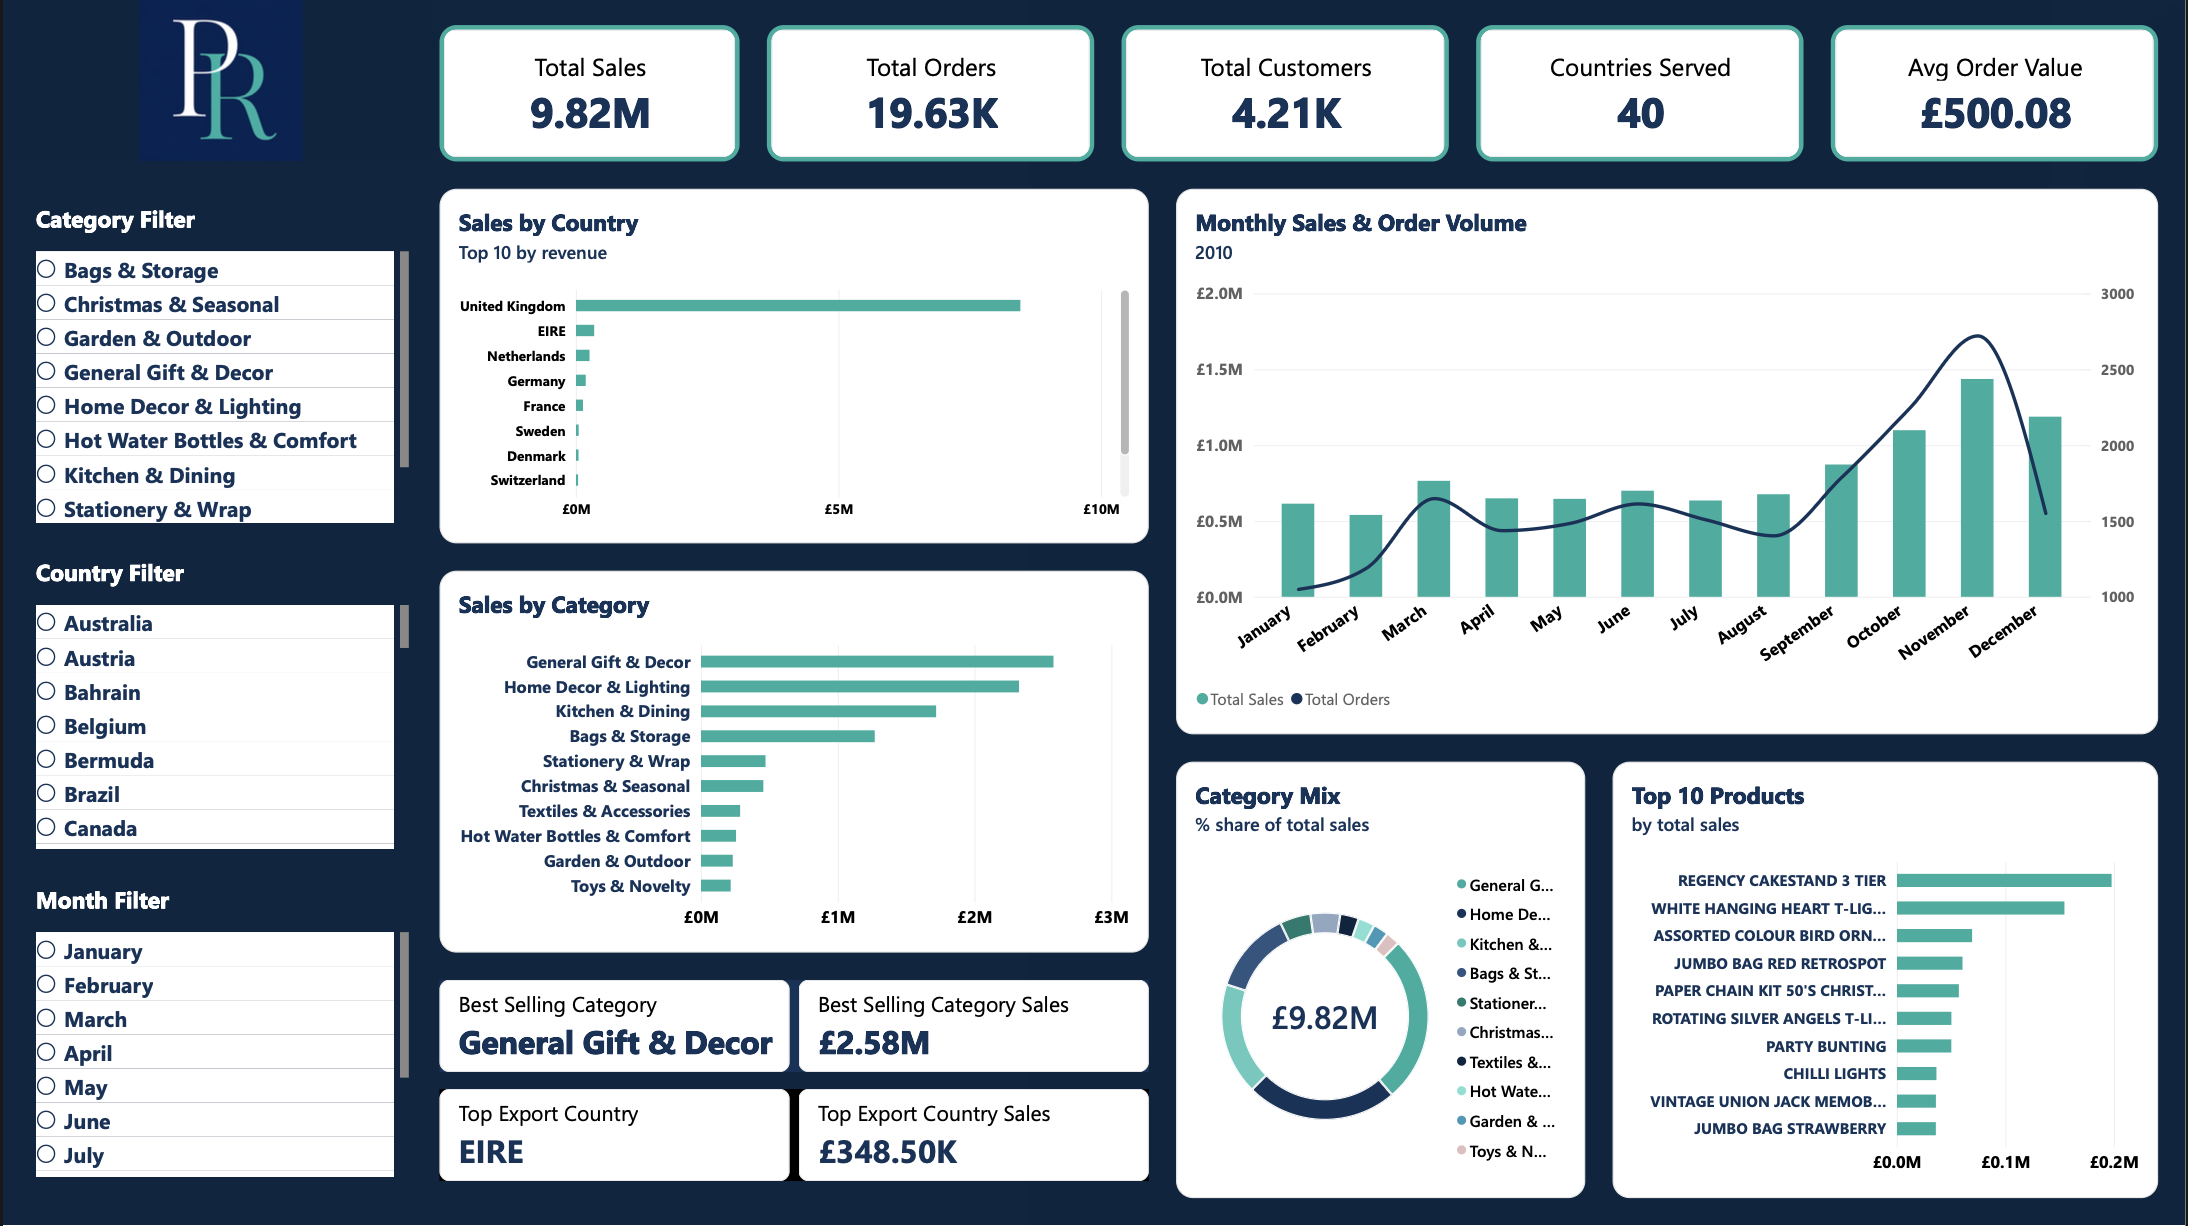
I isolated the 2010 calendar year (506,738 order lines after cleanup), removed cancelled invoices, refunds, and non-product entries like postage and fee adjustments, and derived ten product categories by matching keywords against the real product descriptions. Everything lives on a single Power BI page: five KPI cards, a slicer rail for country, category, and month, and a body mixing bar charts, a monthly trend, and a category breakdown. No profit or margin card, no public dataset discloses a real company's actual margins, so I left it out rather than estimate one.
Key Technical Challenges & How I Solved Them
Challenge
No product categories existed in the raw data.
Solution
Derived ten categories by keyword-matching real product descriptions.
Challenge
Cancellations, refunds, postage and fee lines were mixed in with real sales.
Solution
Filtered cancelled invoices and non-product entries before any KPI was built.
Challenge
No profit or margin field in the dataset.
Solution
Left margin out entirely instead of estimating a number that could mislead.
Results
£9.82M across 19,628 orders from 4,205 customers in 40 countries, average order value £500. But the real finding is the shape of the year: September through December account for 46.8% of annual revenue, and November alone (£1.44M) is more than double the January-August monthly average, exactly what you'd expect from a gift-ware wholesaler selling into the holiday season. Geographically, the UK is 86.2% of revenue, but the strongest export market isn't Germany or France, it's Ireland (EIRE) at £348.5K. By category, Home Decor & Lighting leads at 23.7% of sales. Inventory and staffing should be planned around the real seasonal curve, not an assumed one, with nearly half the year's revenue landing in the last four months, resourcing evenly across twelve months under-serves the actual busiest quarter. Ireland's lead over every other export market, with no special push behind it, is also worth a closer look before assuming the next growth market is somewhere flashier.