For this project, I analyzed over 238,000 NYC traffic collision records to explore when accidents occur most often and which factors contribute to more dangerous outcomes. The goal was to move beyond raw counts and focus on patterns that could inform real-world safety decisions.
What I Did?
I structured the analysis around three key questions:
- How do traffic collisions vary throughout the year?
- Are there specific days and times when collisions are more likely?
- Which contributing factors and vehicle types are associated with higher injury risk?
Using Excel PivotTables and visualizations, I built a single-page dashboard that highlights trends across time, behavior, and vehicle type.
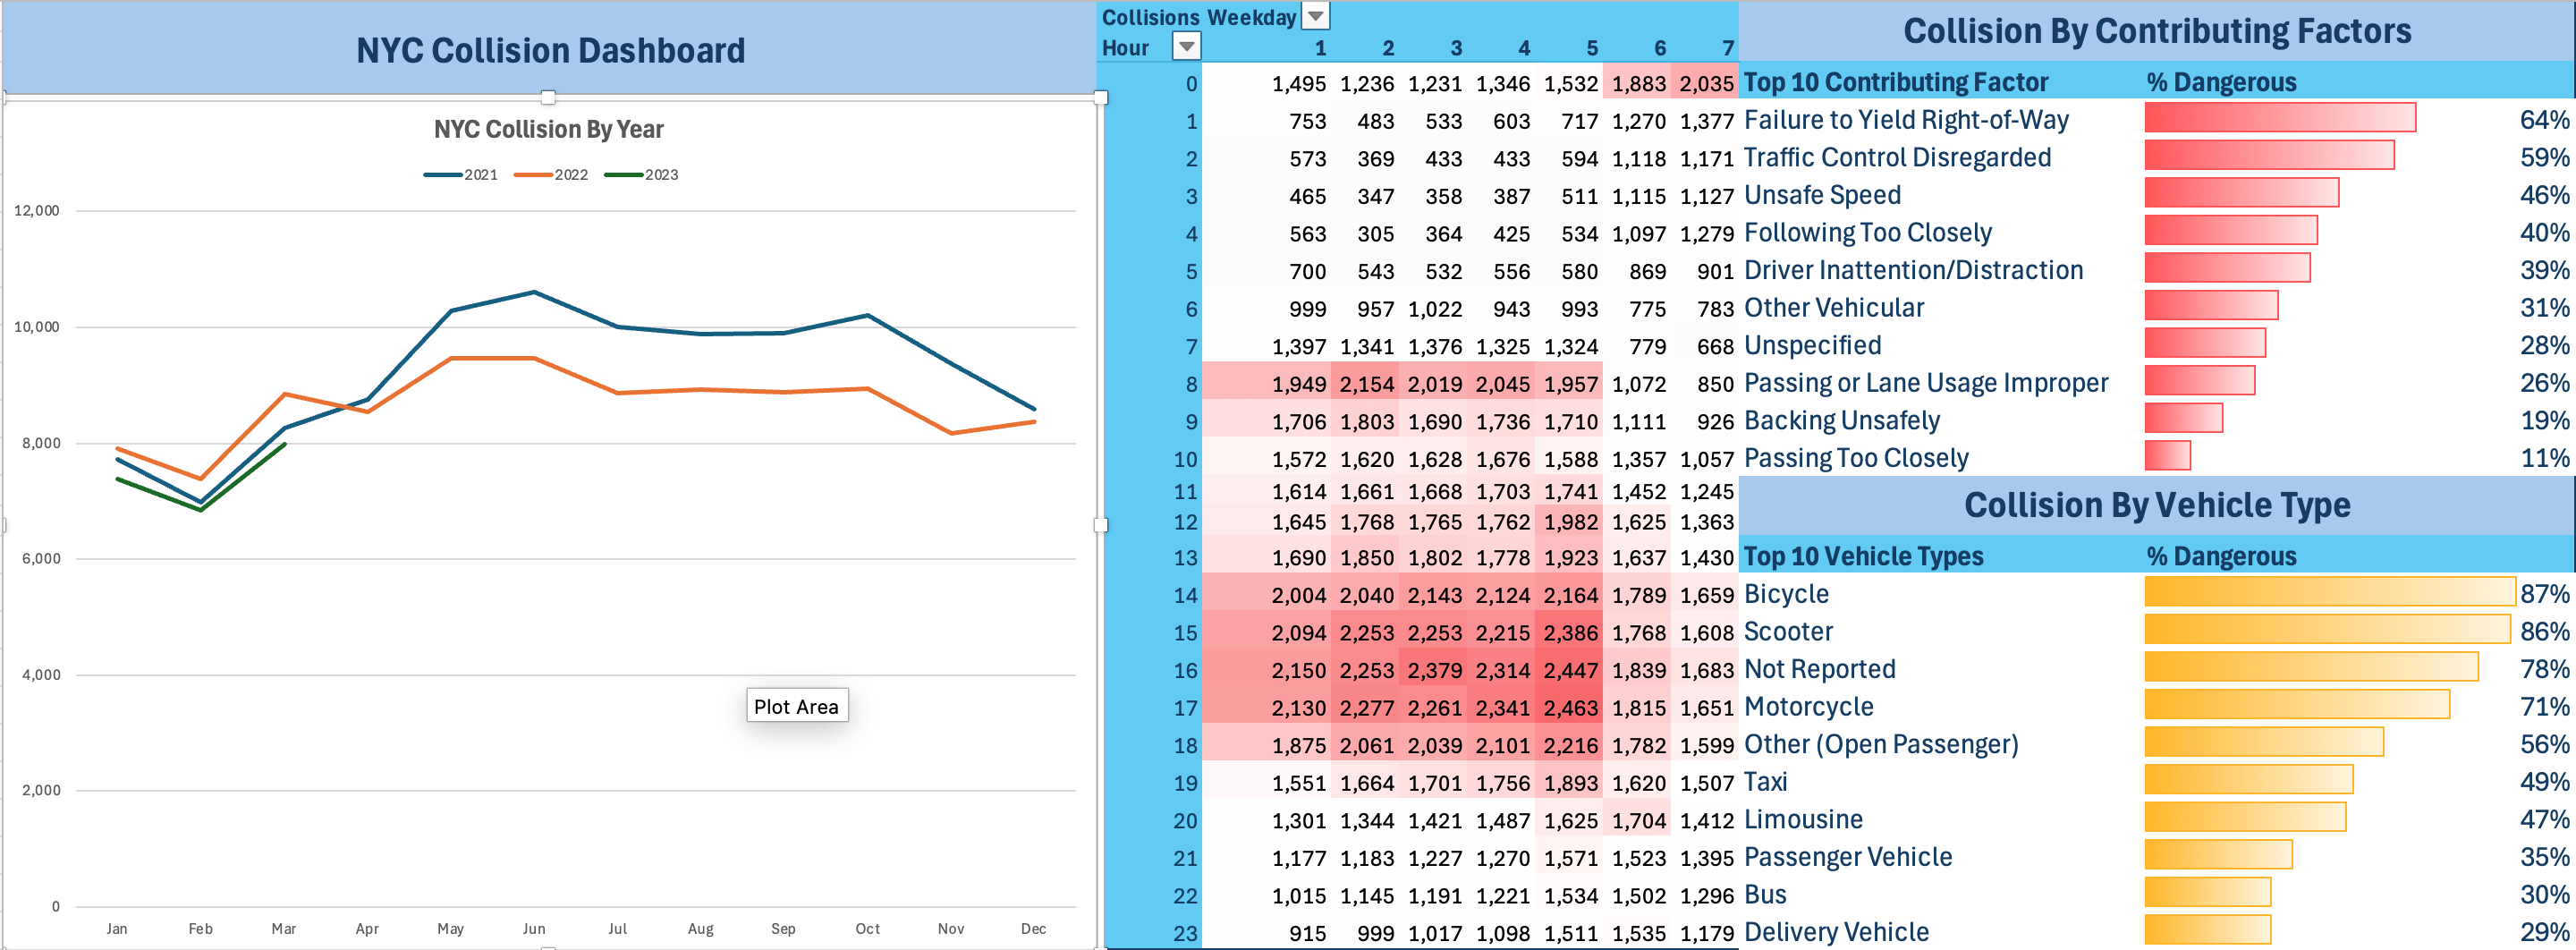
To analyze seasonality, collision counts were aggregated by month and year and visualized using a multi-line chart. The results show clear seasonal patterns, with collisions generally increasing during the spring and early summer months and declining during winter. Additionally, overall collision volume was highest in 2021, followed by a gradual decrease in 2022 and 2023.
Weekly and hourly trends were explored using a heatmap, which revealed clear collision hotspots throughout the week. The heatmap shows that Fridays between 3:00 PM and 5:00 PM experience the highest number of collisions, aligning with afternoon rush hour traffic and increased end-of-week travel. In contrast, early morning hours consistently show the lowest collision activity.
Finally, the analysis examined contributing factors and vehicle types to better understand collision severity. Certain driver behavior factors, such as failure to yield and traffic control disregard, were associated with a higher percentage of injuries or fatalities. Vulnerable road users, including cyclists and scooter riders, showed disproportionately higher injury rates compared to passenger vehicles.
The final deliverable is an interactive Excel dashboard that combines time-based trends, heatmap analysis, and severity metrics to support data-driven traffic safety insights.
Key Insights
- Collisions increase significantly during spring and summer, peaking in late spring.
- Weekday afternoons, particularly during commuter hours, represent the highest collision risk.
- Driver behavior factors such as failure to yield and disregarding traffic controls are both common and dangerous.
- Collisions involving bicycles and scooters show a much higher likelihood of injury, emphasizing the vulnerability of these road users.
Why This Matters
This project reinforced how time-based patterns and human behavior strongly influence traffic safety. Even simple aggregations, when paired with clear visuals, can uncover insights that are valuable for urban planning, traffic enforcement, and public safety initiatives.


Leave a comment